The Climate Impact of Seattle’s Cruise Business 2019 – 2025
Sources & Methods
Here are the sources of the data on which our estimates are based and the methods used to compute greenhouse gas emissions.
Cruises
Which cruises were included
Emissions calculations are for ships that use Seattle as a home port, meaning that the ships start and end their journeys in Seattle. For example, in 2025, there were 286 cruises that started and ended in Seattle. Ten other cruises visited Seattle as a “port of call:” the ships started and ended their journeys elsewhere, and just stopped in Seattle for the day. Emissions from these “port of call” ships are not included.
Greenhouse gas emissions from ships
The site myclimate.org has a carbon calculator for cruise ships. myclimate is a nonprofit climate protection organization that was spun off from the Swiss Federal Institute of Technology Zurich (ETH Zurich) in 2002; it receives academic support from several institutes in the university, including the ETH Centre for Sustainability, as well as the Swiss Federal Office for Energy.
The myclimate carbon calculator computes the total climate impact of each cruise voyage, based on ship size (passenger capacity), number of sailing days, and the number of days the ship stops in a port; it then apportions that total to individual passengers, assigning an individual “carbon footprint” to each one. Our computations reverse that process: in each category of ship size, voyage length, and number of port stops, we use the calculator to find the carbon footprint of one passenger, then multiply that result by the number of passengers on the ship. This is done for each home-ported voyage throughout the season.
The myclimate calculator assigns a larger portion of emissions to a passenger staying in a large suite than to one occupying a smaller, double-occupancy room. We make a simplifying and conservative assumption that all passengers are in double occupancy rooms.
Calculation principles and data sources for the myclimate carbon calculator are given here. Note that in addition to emissions that result from burning fuel, their calculations include indirect emissions from the ship’s manufacture, maintenance, and disposal; emissions in port; and emissions from catering and refrigerants. All emissions are over a 100-year time horizon.
Currency of cruise emissions data sources
The myclimate carbon calculator uses the Ecoinvent database, a comprehensive, transparent, and widely recognised database for assessing the lifecycle environmental impacts of a wide variety of activities. It includes a comprehensive database of ships, with information from a range of cruise lines.
As of 2025, myclimate.org is using an older version of the Ecoinvent database; this version assumes that ships are running on diesel fuel. To the best of our knowledge, this is appropriate for all cruise ships visiting Seattle in 2019 and 2024. After the 2025 season ended, the Port of Seattle announced that 3 cruise voyages had been on ships running on biofuels. There is considerable uncertainty as to whether biofuels have a higher or lower lifecycle climate impact than conventional marine fuel, but in any case, these ships represent less than 2% of the voyages, so we expect this discrepancy to have only a minor effect.
Number of ships; number of passengers
The total number of cruise passengers using Seattle as a home port was computed from:
- Port of Seattle cruise schedules for 2019, 2024, and 2025, which list all ship calls.
- For the number of passengers on each (home-ported) ship, we found double- occupancy numbers from the Wikipedia entry for each ship, and from cruisemapper.com.
- For 2019, we used the double-occupancy rate.
- For 2024, we used 104% of the double-occupancy rate, based on the City and Borough of Juneau Docks & Harbors bulletin from November, 2024, which said that over the entire 2024 cruise season, the number of passengers on each ship averaged 104% of the double-occupancy rate.
- For 2025, we used 102% of the double-occupancy rate, based on statements by the Port of Seattle.
Ship itineraries, duration of voyage, and number of days that included a stop at a port (“port stay days”) are from cruisemapper.com and gangwaze.com.
Accounting for use of Seattle’s shore power
Some ships plug into Seattle’s electric grid while at berth in Seattle, turning off their main engines. Here are the estimated metric tons of CO₂e avoided through the use of shore power: the 2019 number is from Port staff; the numbers from 2024 and 2025 are from the Port’s Cruise Dashboard for 2024 and 2025.
| Year | Emissions Avoided (mtCO₂e) |
| 2019 | 3,000 |
| 2024 | 3,957 |
| 2025 | 6,444 |
The avoided emissions were subtracted from the total ship emissions.
A detailed spreadsheet showing each home-port voyage, the duration of the voyage, the number of “port stay days” (the number of days the ship stopped at a port), and associated greenhouse gas emissions is found here: Cruise Data.
Flights
Number of cruise passengers who fly here
According to the Port of Seattle, approximately 85% of Seattle’s domestic cruise passengers fly here.
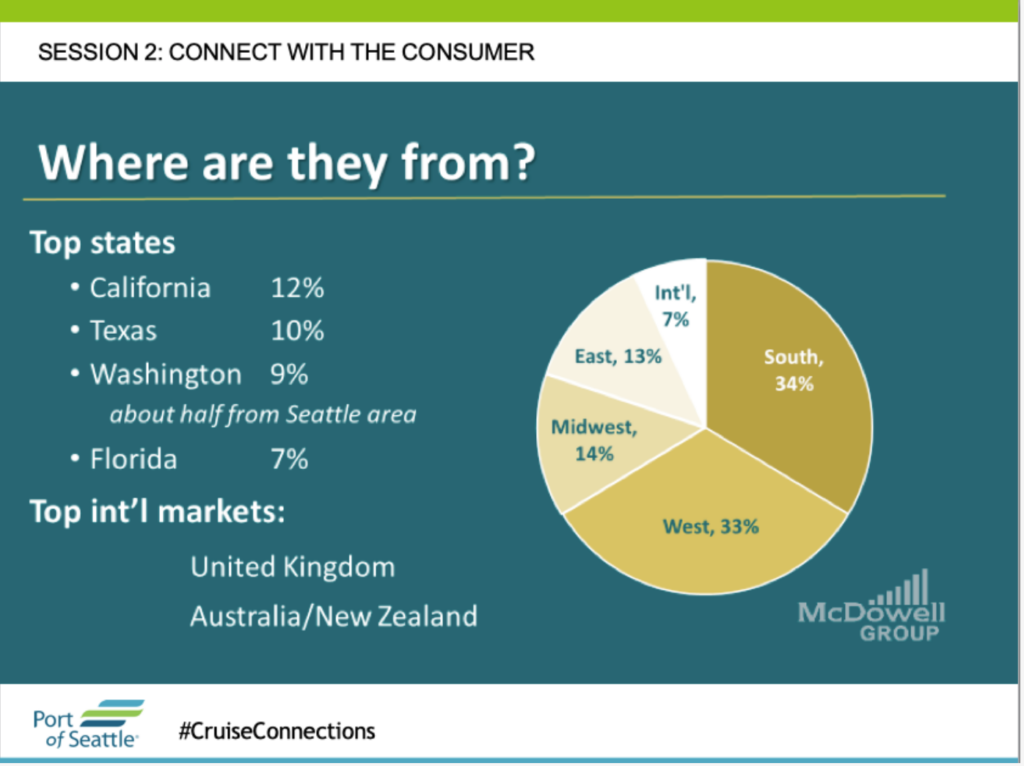
Where they flew from
The slide below was shown at a Cruise Connections conference held in Seattle in 2019; it shows that 93% of cruise passengers were domestic; 7% were international.
So, flying passengers consist of:
- all international passengers (= 7% of total number of passengers), plus
- 85% of domestic passengers (85% of the remaining 93% of the total)
This is equivalent to 86.05% of all passengers.
Greenhouse gas emissions from flights
For each region or state from the Cruise Connections slide, a centrally located city was chosen as a proxy for the whole region, and emissions for one person taking a round trip flight from there to Seattle were calculated, using the site atmosfair.de. That number was then multiplied by the number of people who came from that region.
atmosfair is a nonprofit climate protection organization based in Germany, founded in 2004 as a project of the Federal Ministry for the Environment.
There are many sites with flight emissions calculators; atmosfair.de was chosen because it includes the effect of high altitude non-CO₂ emissions, giving a more complete accounting of climate impacts, and also because the site is meticulous in keeping its data up-to-date.
International locations were chosen in accordance with a 2024 presentation by port staff, saying that top international markets were UK/Ireland, Germany, Australia, Japan, and South Korea.
Currency of Flight Emissions Data
Documentation of methods and data used by the atmosfair calculator can be found here. Notably, atmosfair frequently updates the data on which its carbon calculator depends. From the site:
Aircrafts in world air traffic constantly undergo technical improvements and are becoming more and more fuel-efficient in the process. For this reason, atmosfair constantly updates the data for the CO2 calculation and can thus, among other things, represent the aircraft fleets of the world’s airlines in detail. Aircraft types, engines and load factors are updated annually, while aircraft configurations are updated quarterly and flight schedules every two months.
Cabin class
We made simplifying and conservative assumptions that all passengers flew coach class in 2020 (explained below), and all passengers flew economy class in 2025. Coach and economy class seats are assigned a lower carbon footprint than seats in premium economy, business, or first class cabins.
Estimates for 2019 and 2024
As stated above, the atmosfair emissions factors are frequently updated, to reflect the fact that airplanes are becoming increasingly efficient over time. Ideally, the atmosfair site would be accessed during the year the flights took place. However, the atmosfair site was accessed in April, 2020 and in August, 2025, and unfortunately, emissions factors from prior years (2019 and 2024) are no longer accessible. To estimate reasonable factors for 2019 and 2024, we used the emissions factors for 2020 and 2025 to create a linear function for each location, and used the linear function to estimate emissions values for 2019 and 2024. Computation of this function can be found here.
A word about Seoul: For Seoul, we had only 2025 emissions data; we did not have access to 2020 emissions data. However, since Seoul and London had similar emissions in 2025, we used the change in London emissions to estimate the change in Seoul emissions. We calculated the percentage by which 2019 and 2024 London emissions differed from 2025 London emissions, and increased Seoul’s 2025 emissions by the corresponding percentages to estimate its 2019 and 2024 emissions.
This Flight Data spreadsheet contains the following information:
- Emissions calculations for round-trip flights to Seattle for the appropriate number of cruise passengers from each of the regions in the Cruise Connections slide above, for the years 2019, 2024, and 2025
- Computations of the linear functions used to estimate 2019 and 2024 emissions
- Calculation of the estimated 2019 and 2024 emissions factors for flights from Seoul
Feedback
We welcome questions and corrections. Please contact info@seattlecruisecontrol.org.